What is BigQuery?

Google BigQuery is a fully-managed, serverless data warehouse that enables super-fast SQL queries using the processing power of Google’s infrastructure. It’s designed for analyzing large datasets and is commonly used for business intelligence, data analytics, and machine learning.

BigQuery Connection Requirements

Unlike traditional databases that use username/password authentication, BigQuery uses Google Cloud Service Accounts for secure API access. This means you’ll need:
  1. A Google Cloud Project with BigQuery enabled
  2. A Service Account with appropriate permissions
  3. A Service Account Key (JSON file) for authentication (how to generate)
  4. Below are the minimum required BigQuery permissions for Julius to work.

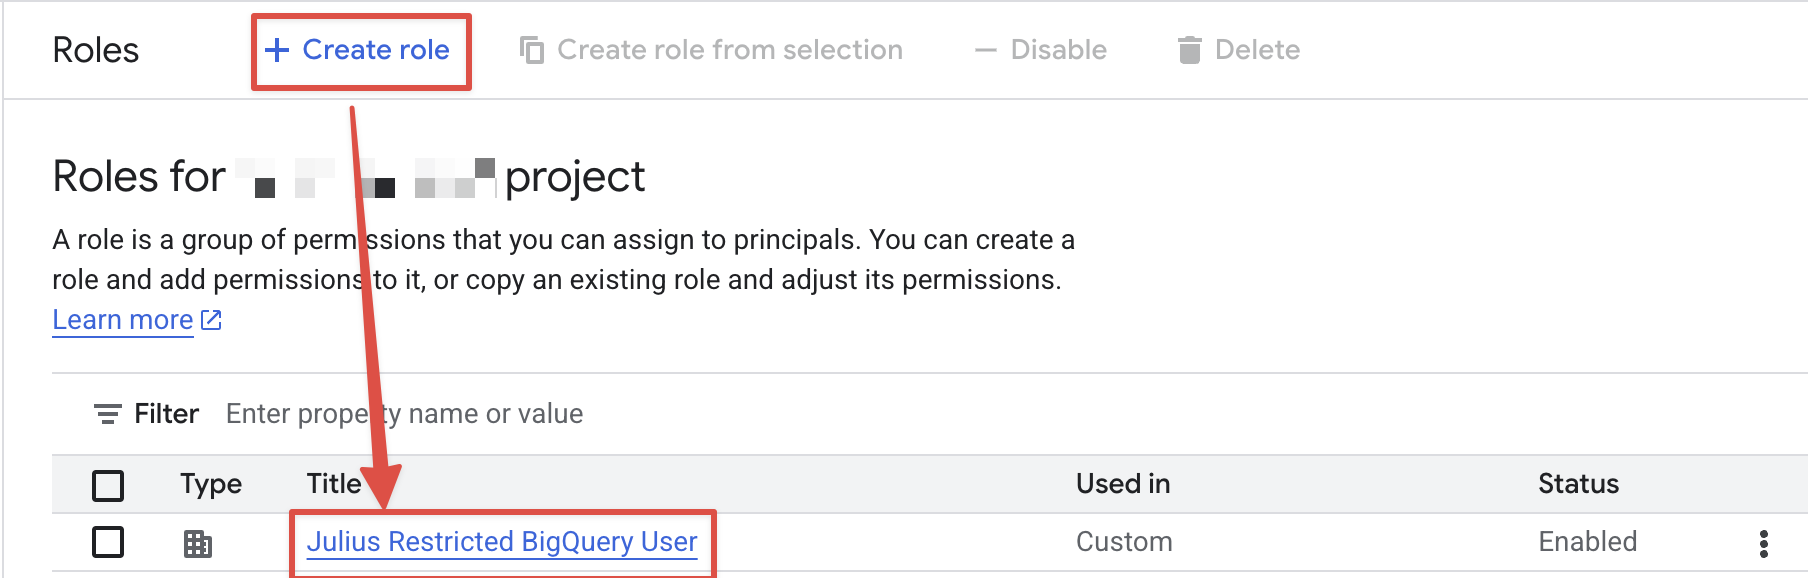
Providing the minimum required permissions

  1. Navigate to the Google Cloud Console IAM Roles
  2. Create a new role with the following permissions:

Minimum Required Permissions

Your service account needs at least the following permissions to work with BigQuery:
  • bigquery.jobs.create - Required to execute a BigQuery job
  • bigquery.readsessions.create - Required to create a read session
  • bigquery.readsessions.getData - Required to get data from a read session
  • bigquery.tables.get - Required to access metadata about a table
  • bigquery.tables.getData - Required to get data from a table
  • bigquery.tables.list - Required to list available tables in a dataset
  • bigquery.routines.get - Required to access metadata about a routine
  • bigquery.routines.list - Required to list available routines in a dataset
iam-roles
  1. Assign the roles to the service account
iam-roles

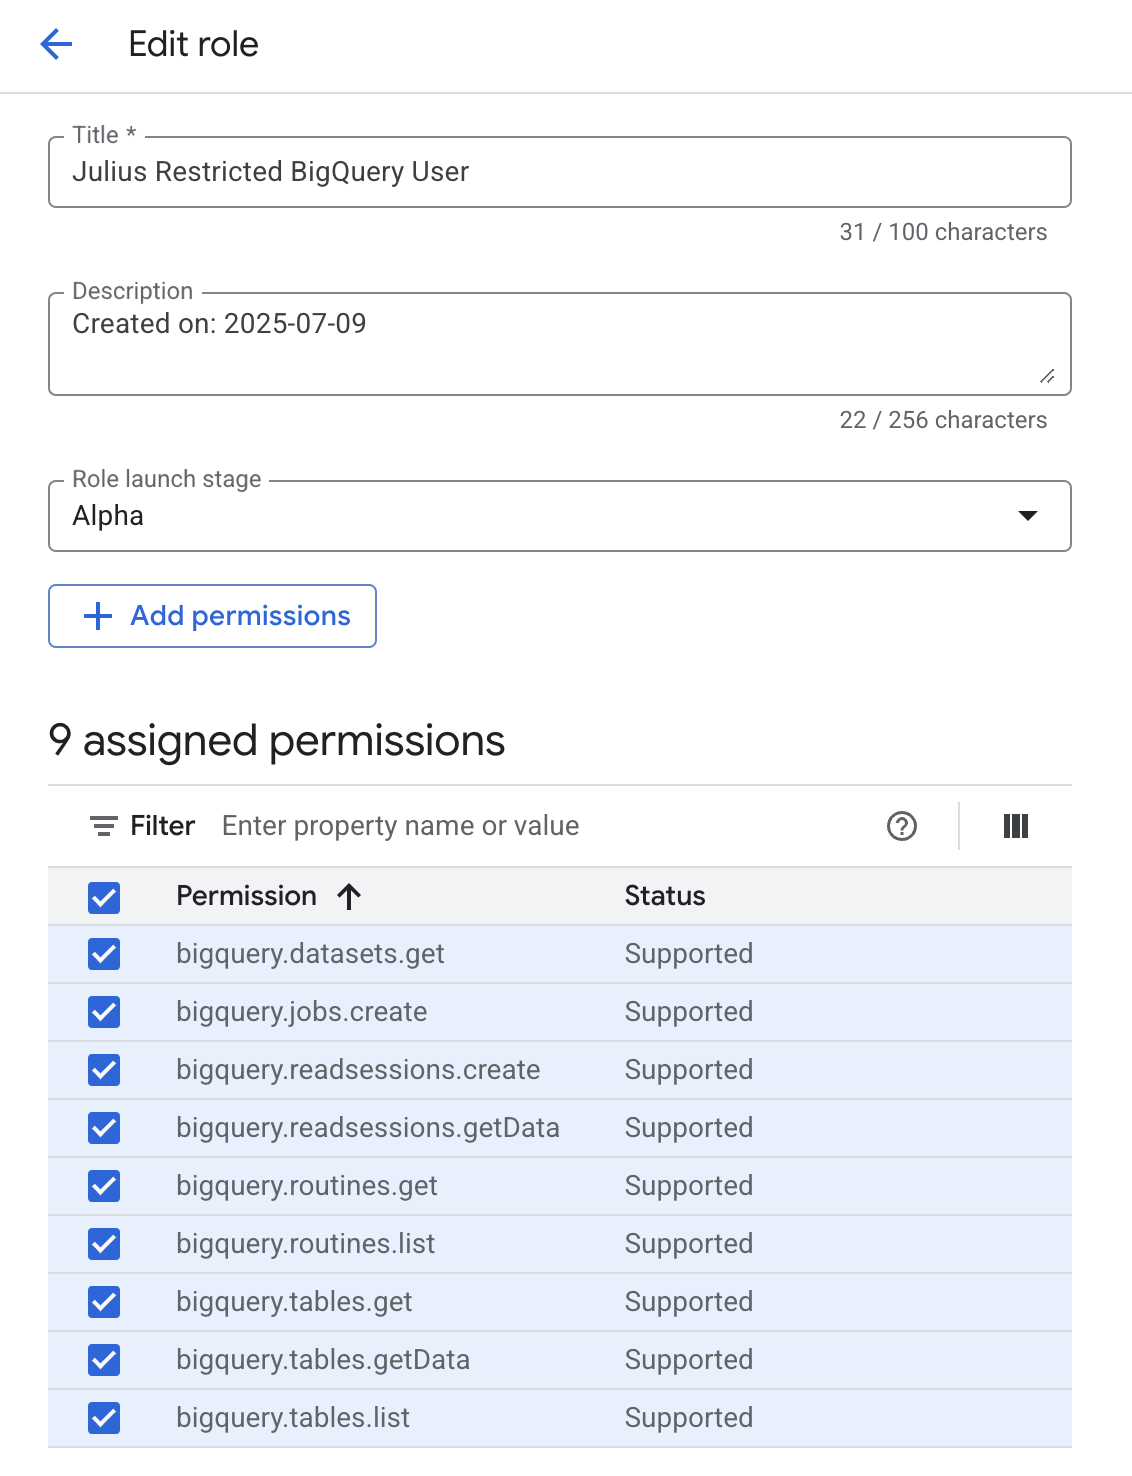
More Granular Permissions

The following permissions allow julius to access information about available tables. Currently, BigQuery does not provide a way to restrict viewing metadata to specific tables. However, you can restrict access to viewing the data within specific tables.
  • bigquery.tables.get - Required to access metadata about a table
  • bigquery.tables.list - Required to list available tables in a dataset
  • bigquery.routines.get - Required to access metadata about a routine
  • bigquery.routines.list - Required to list available routines in a dataset
You can view Google’s documentation to understand why we need these permissions: BigQuery Information Schema Tables With this, you could create two roles, one role that allows julius to access the high level metadata about the tables and another role that allows julius to access particular data within a subset of tables. The second role would contain the following permissions:
  • bigquery.tables.getData - Required to get data from a table
  • bigquery.readsessions.getData - Required to get data from a read session
You can then apply more granular permissions for each table you want to allow julius to access on this role.

Connecting Julius to BigQuery

Navigate to Data Connectors

  1. Go to your Julius Data Connectors Settings 2. Click Create new Data Connector 3. Select BigQuery from the available options

Configure Connection Details

You’ll see a form with the following fields:
Fields marked with an asterisk (*) are required to establish a connection.
Connection Name*
string
  • What it is: A friendly name to identify this BigQuery connection
  • Example: “Production Analytics” or “Sales Data Warehouse”
  • Tip: Choose a name that helps you remember which BigQuery project/datasets this connects to
SERVICE_ACCOUNT_JSON*
object
  • What it is: The complete JSON content from your downloaded service account key file
  • How to use: Open the downloaded JSON file in a text editor and copy the entire contents
  • Security: Julius encrypts and securely stores these credentials
Make sure to copy the entire JSON content including the opening and closing curly braces { }. Missing any part will cause authentication to fail.
MFA_TYPE
string
  • What it is: Multi-Factor Authentication type if your organization requires additional security
  • When needed: Only if your Google Cloud organization has additional authentication requirements
  • Most users: Can leave this blank unless specifically required by your organization’s security policy

Test and Save Connection

  1. Click Add Connection to test the connection
  2. Julius will validate your service account credentials and access permissions
  3. If successful, your connector will be saved and ready to use
  4. If there’s an error, check the common issues section below

Troubleshooting Common Issues

Using Your BigQuery Connector

Once your BigQuery connector is set up:
  1. Start a conversation with Julius
  2. Ask about your data using natural language:
    • “Show me sales data from the last quarter”
    • “What’s the average order value by region?”
    • “Create a chart showing user growth over time”
  3. Julius will automatically:
    • Connect to your BigQuery project
    • Write and execute SQL queries
    • Handle BigQuery’s specific syntax and functions
    • Present results in easy-to-understand formats
    • Create visualizations when requested
Julius understands BigQuery’s unique features like nested/repeated fields, array functions, and standard SQL syntax. You don’t need to know BigQuery-specific SQL!

Query optimization for large-scale BigQuery warehouses

Basic mechanics - How BigQuery pricing works

  1. BigQuery charges per TB of data scanned (not stored)
  2. When you run SELECT * on a 100M record table, you pay for scanning every column
  3. Unfiltered queries scan entire tables regardless of result size
  4. Partitioned tables allow BigQuery to skip irrelevant data chunks
  5. Clustered tables organize data for faster retrieval within partitions

Key characteristics of cost-effective queries

  • Column selectivity: Only request needed columns (SELECT specific_cols vs SELECT *)
  • Row filtering: Use WHERE clauses with partitioned/clustered columns
  • Partition pruning: Filter on partition keys (usually date/timestamp)
  • Early aggregation: Group/summarize before joining large tables
  • Query caching: Identical queries reuse previous results

Concrete examples

Expensive query (might scan 3TB)
SELECT * FROM sales_data 
WHERE customer_id = '12345'
Optimized query (might scan 50GB)
SELECT customer_id, order_date, total_amount 
FROM sales_data 
WHERE DATE(order_date) >= '2024-01-01' 
  AND customer_id = '12345'

BigQuery smart prompting framework on Julius

1. Always include time boundaries

Why this matters: Tables can contain years of data. Without time limits, Julius might scan everything.
Costly approach: “What are our sales trends?”
Cost-effective approach: “Show me daily sales trends for the past 3 months”
Why it’s better: The first query forces Julius to scan the entire sales history (potentially years of data). The second query uses date partitioning to scan only 3 months of data - potentially reducing processing by 80-90%. Pro tip: Start with recent data for exploration, then expand timeframes only when needed.

2. Be specific about what you need

Why this matters: Julius will include relevant columns and metrics based on your request. Vague requests lead to broader data pulls.
Costly approach: “Analyze our customer data”
Cost-effective approach: “Show me customer purchase frequency and average order value for active customers in Q4”
Why it’s better: The first query might pull every customer attribute across all time periods. The second targets specific metrics (purchase frequency, AOV) for a defined segment (active customers) in a specific period (Q4). This could reduce data processing by 70-95%.

3. Use smart sampling for exploration

Why this matters: When you’re exploring patterns or testing hypotheses, perfect precision often isn’t necessary.
Costly approach: “What patterns do you see in user behavior?”
Cost-effective approach: “Analyze login patterns and session duration using a 20% sample of users from the past month”
Why it’s better: The first query processes every user interaction ever recorded. The second processes only 20% of recent data, which is typically sufficient for pattern recognition and costs 80% less while still providing statistically valid insights.

4. Layer your analysis

Why this matters: Start broad with cost-effective queries, then drill down based on what you discover.
Costly approach: “Give me a complete breakdown of all our metrics by every possible dimension”
Cost-effective approach: “Show me our top 5 product categories by revenue this quarter, then I’ll dive deeper into the most interesting one”
Why it’s better: The first approach processes massive amounts of data upfront. The layered approach finds the most important areas first (small data scan), then focuses detailed analysis only where it matters most.

5. Reference existing summaries when available

Why this matters: We have pre-computed summary tables and views that contain aggregated data.
Costly approach: “What’s our monthly revenue growth?”
Cost-effective approach: “Using our monthly_revenue_summary table, show me growth rates for the past year”
Why it’s better: The first query might aggregate daily transaction data from scratch. The second uses pre-computed monthly summaries, processing 12 rows instead of potentially millions.

Quick check: The smart prompting checklist

Before submitting your query, check:
  • Time Range: Did you specify when? (past month, Q4, last 90 days)
  • Scope: Are you asking for specific metrics or segments?
  • Purpose: Is this exploration (use sampling) or precision analysis?
  • Building Blocks: Can you start with a summary or build on previous work?

Reach out to team@julius.ai for support or to ask questions not answered in our documentation.